Since 2016, NUS Technology has served as the engineering partner behind a global oil and gas analytics platform used by energy professionals to research wells, evaluate basins, and analyze production data across multiple countries. The platform was built from scratch by NUS, from architecture decisions to production deployment, and the partnership continues today as the system scales into new markets.
This was never a project with a handoff date. The client needed a long-term partner who could design a system that handles country-by-country data isolation at massive scale, deliver sub-second report generation for time-sensitive decisions, and continue evolving the platform as the energy industry’s data demands grow.
Name
Confidential
Backend
Ruby on Rails
Database
PostgreSQL (AWS RDS), ElastiCache (Redis)
Frontend
React.js (TypeScript)
Infrastructure
AWS (EC2, S3, RDS, ElastiCache)
Industry
Energy / Oil & Gas Analytics
Market
Global (Multi-Region)
Integration
Google Maps (Geospatial Visualization)

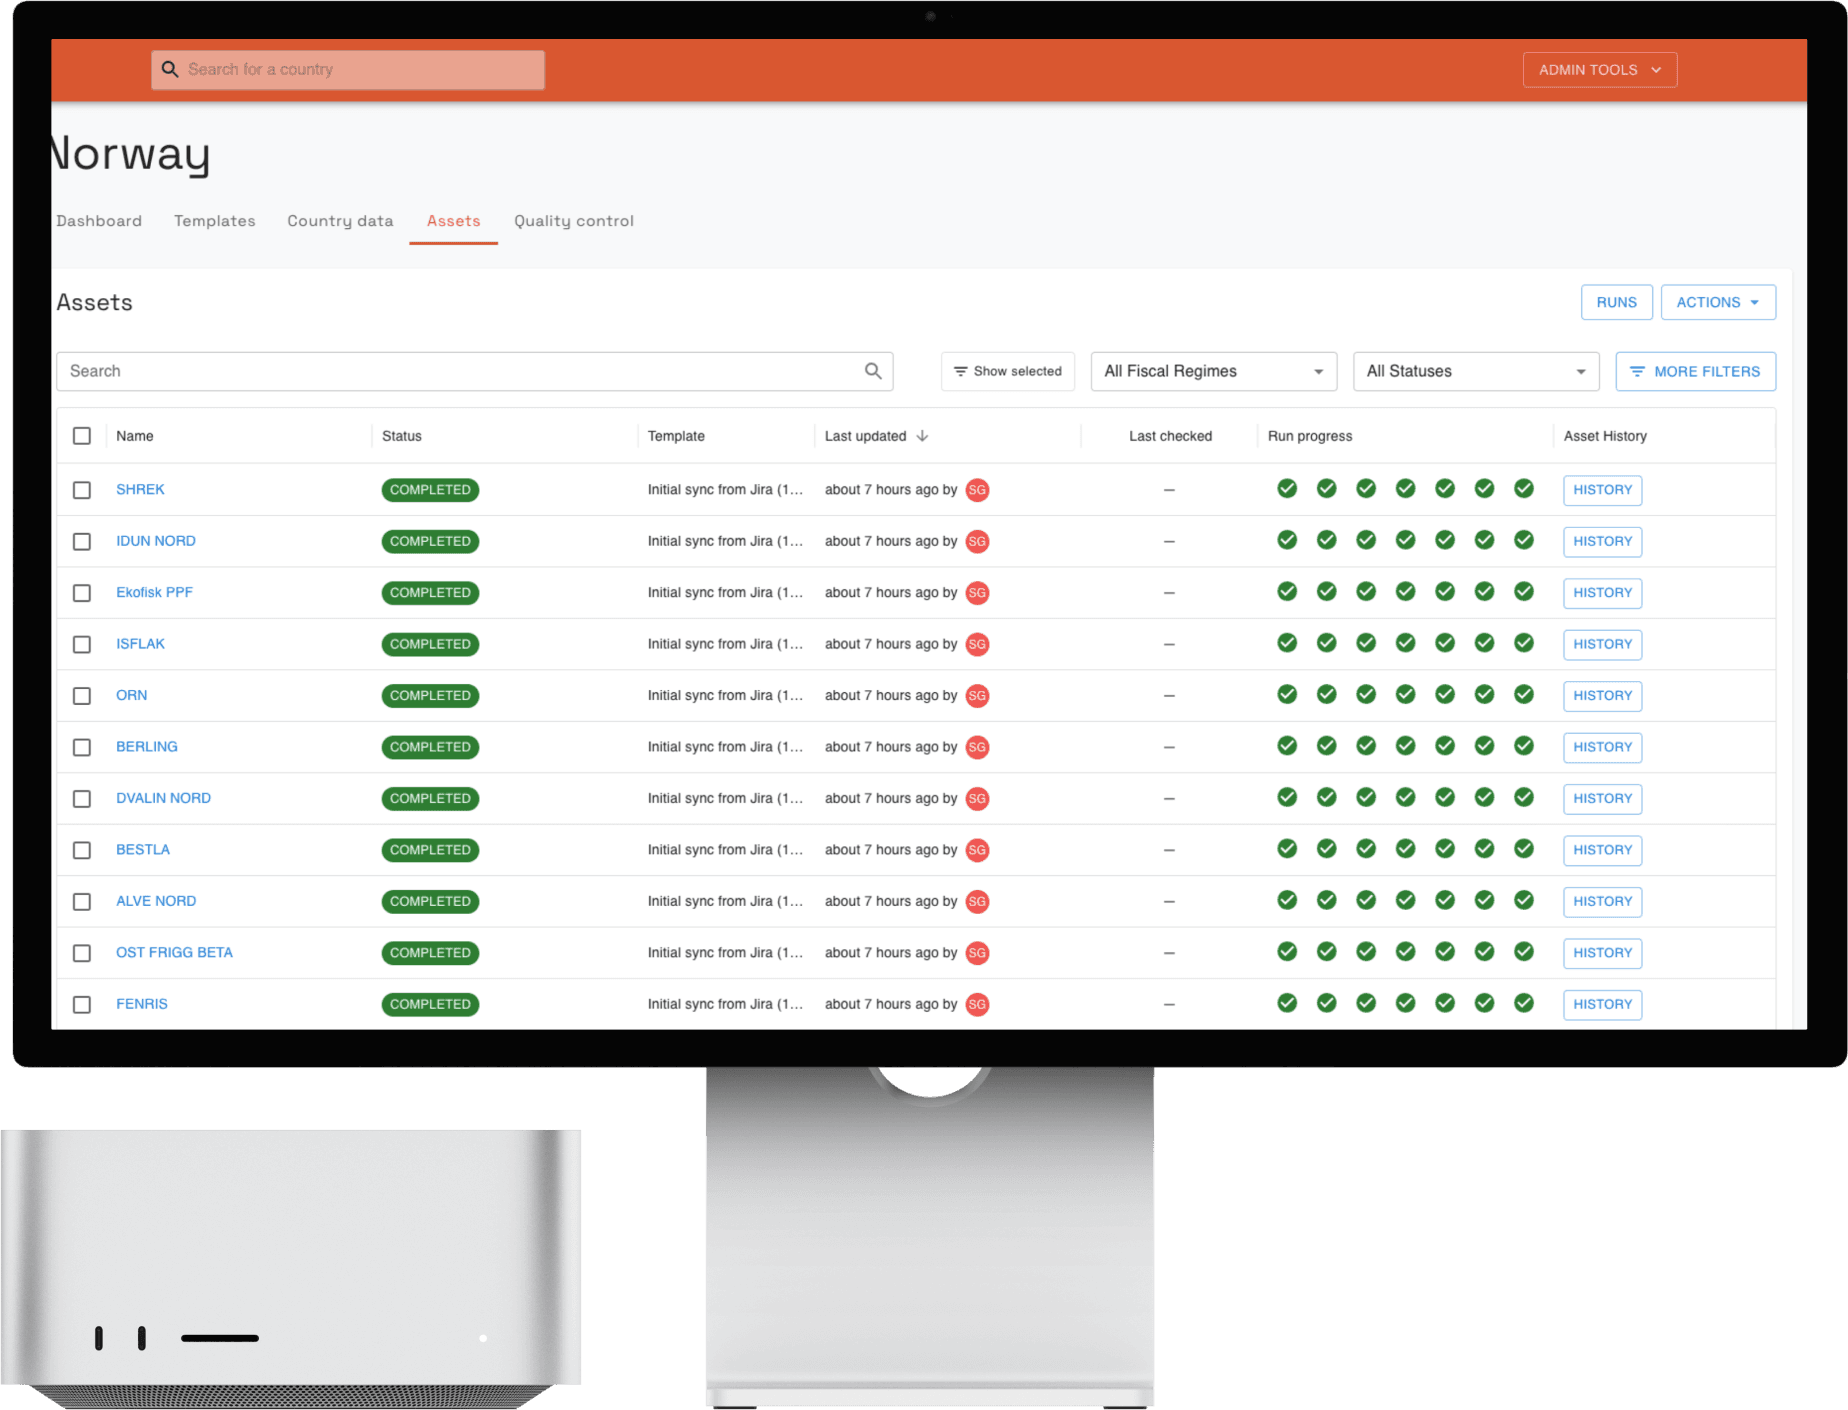
The client’s core product is a research and statistical intelligence platform for the upstream oil and gas sector. Analysts, investors, and operators rely on it to evaluate wells, fields, basins, and production data across multiple countries. The nature of this data creates several hard engineering problems:
Country-Based Data Isolation: Energy data is inherently jurisdictional. Regulatory frameworks, measurement standards, and data release cycles differ by country. The platform required strict tenant isolation at the database level, one dedicated database per country, to ensure data integrity, compliance, and controlled release schedules.
Enormous Data Volume: Each country dataset contains vast quantities of well-level production records, geological data, economic modeling outputs, and historical statistics. Naively querying this data would result in unacceptable response times and ballooning storage costs.
Report Generation Speed: The platform’s primary value proposition is its ability to generate complex analytical reports on demand. Energy professionals making time-sensitive investment or operational decisions cannot afford to wait. Reports had to be generated within seconds, not minutes.
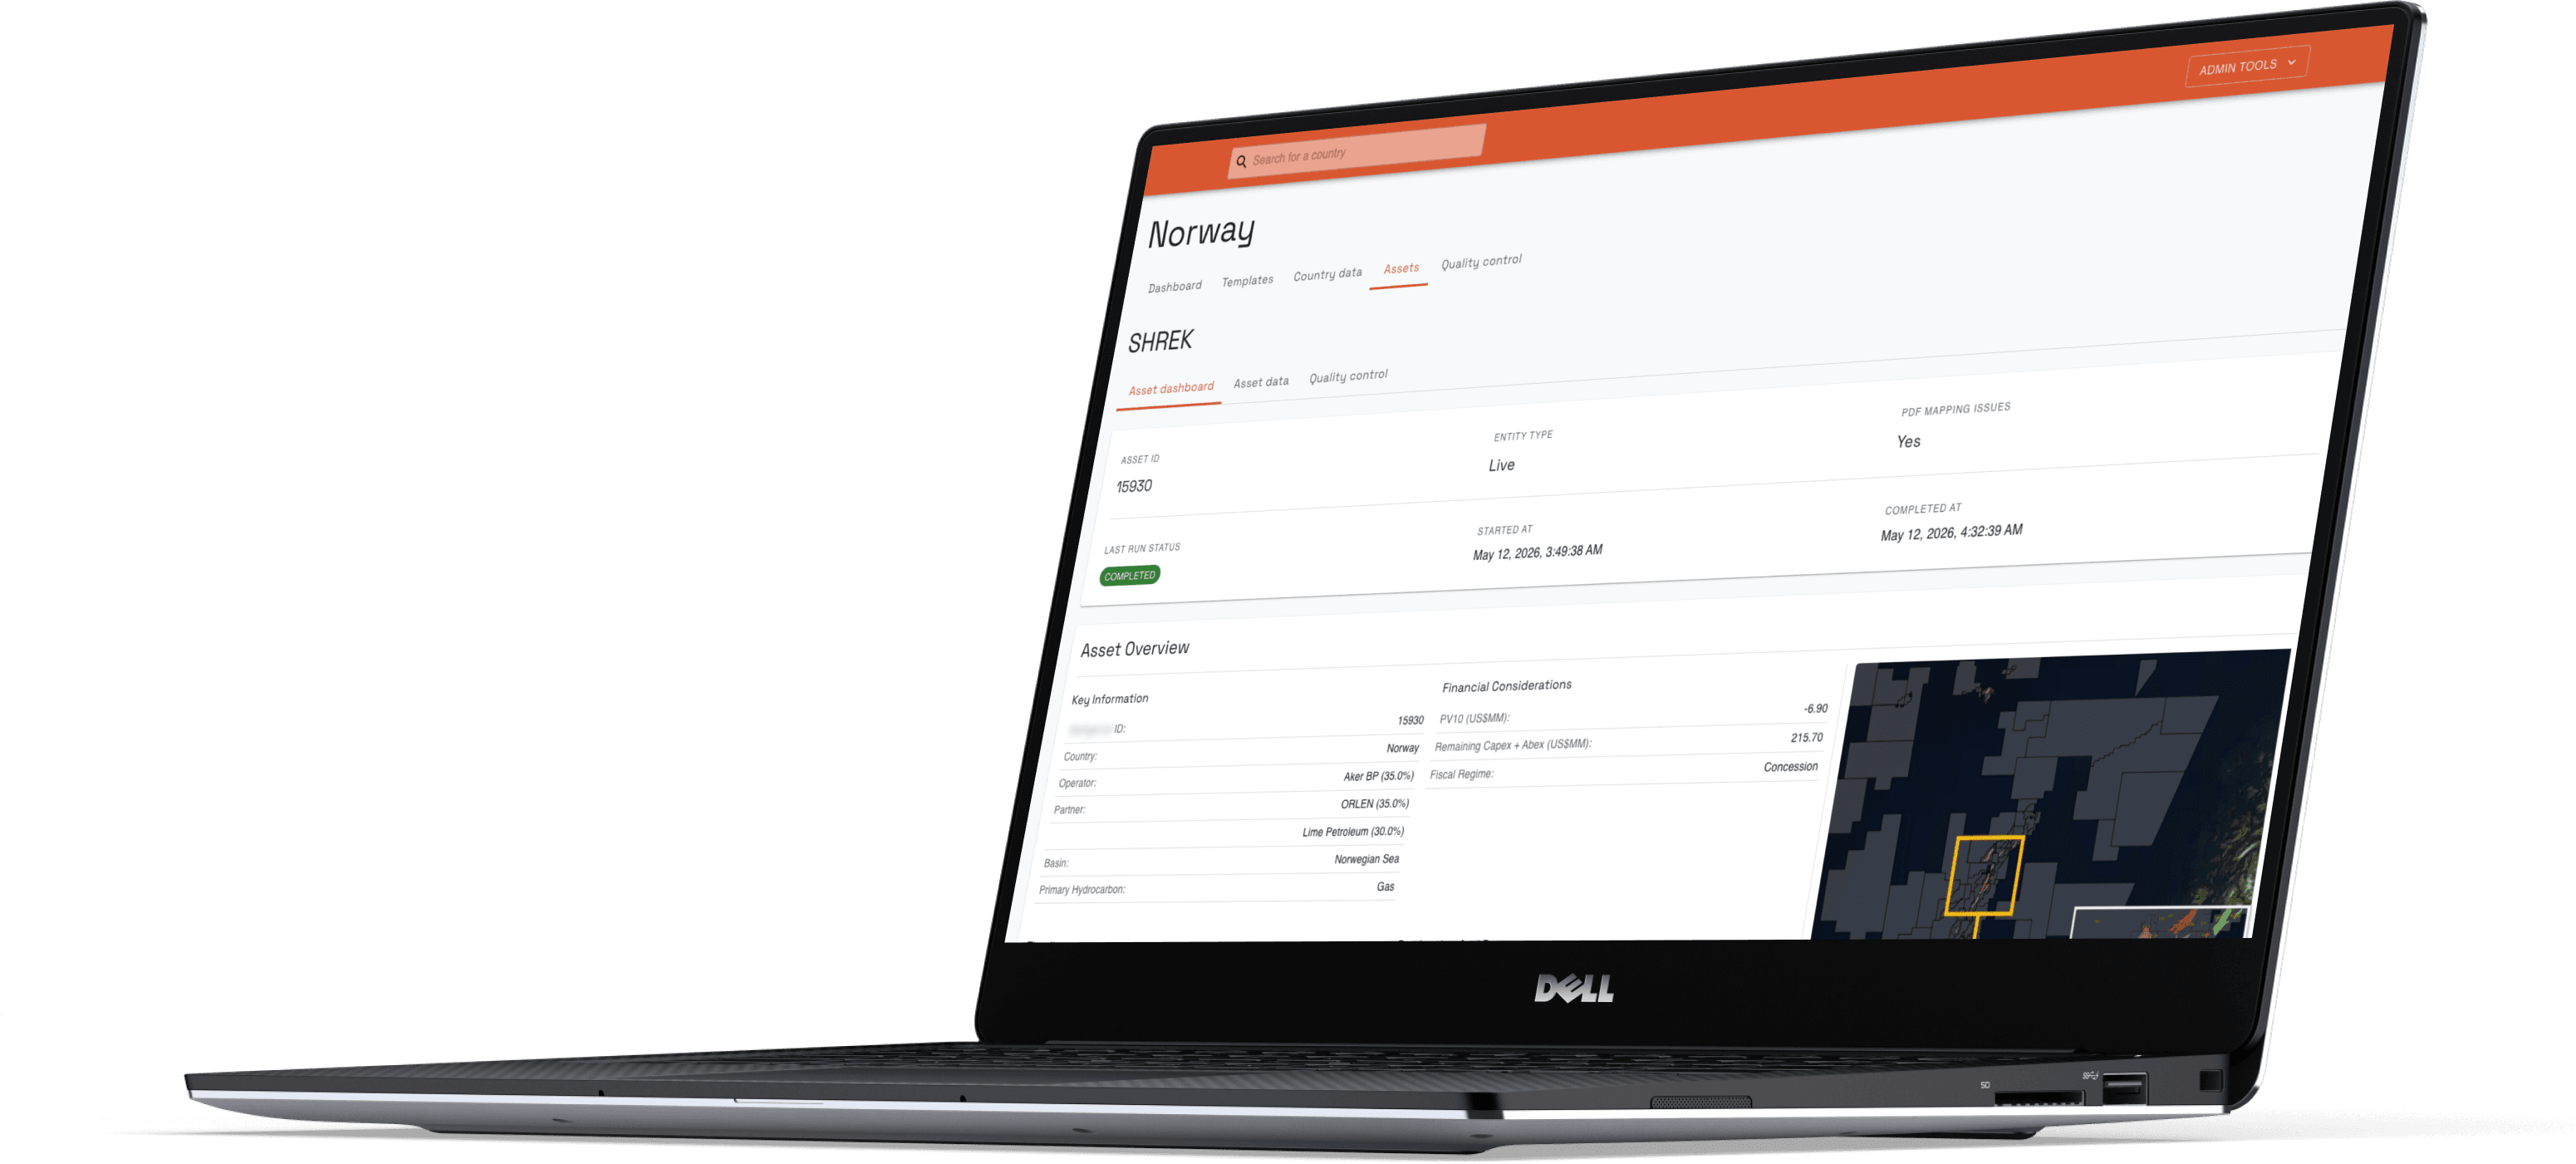
Geospatial Complexity: Visualizing well locations, pipeline networks, and basin boundaries on interactive maps is central to how energy analysts work. The platform needed tight geospatial integration to overlay research data onto real-world geography.
The client needed a partner who could architect a system from scratch that addressed all of these constraints simultaneously, not a team that would bolt together pre-built modules and hope for the best.
NUS Technology designed and built the entire platform from the ground up, making deliberate architectural choices at every layer to match the operational realities of global energy data.
Rather than cramming all country data into a single database with row-level filtering, an approach that would have created a maintenance nightmare and introduced data leakage risks, NUS implemented a true multi-tenant architecture with one PostgreSQL database (via AWS RDS) per country. This design ensures:
Clean data isolation: Each country’s dataset is entirely self-contained, simplifying compliance and audit trails.
Independent release cycles: New country data can be published to production on its own schedule without affecting other regions.
Targeted optimization: Indexing strategies, caching layers, and query plans can be tuned per country based on dataset characteristics.
With datasets of this scale, raw database queries alone are not sufficient. NUS employed multiple optimization techniques across the stack:
ElastiCache (Redis) was deployed as a caching layer, storing frequently accessed query results and pre-computed aggregations to eliminate redundant database hits.
AWS S3 was used for cost-efficient storage of large static datasets and historical archives, keeping the primary databases lean and fast.
Custom query optimization within the Ruby on Rails backend ensured that complex analytical queries, spanning production curves, decline analyses, and economic models, return results within seconds.
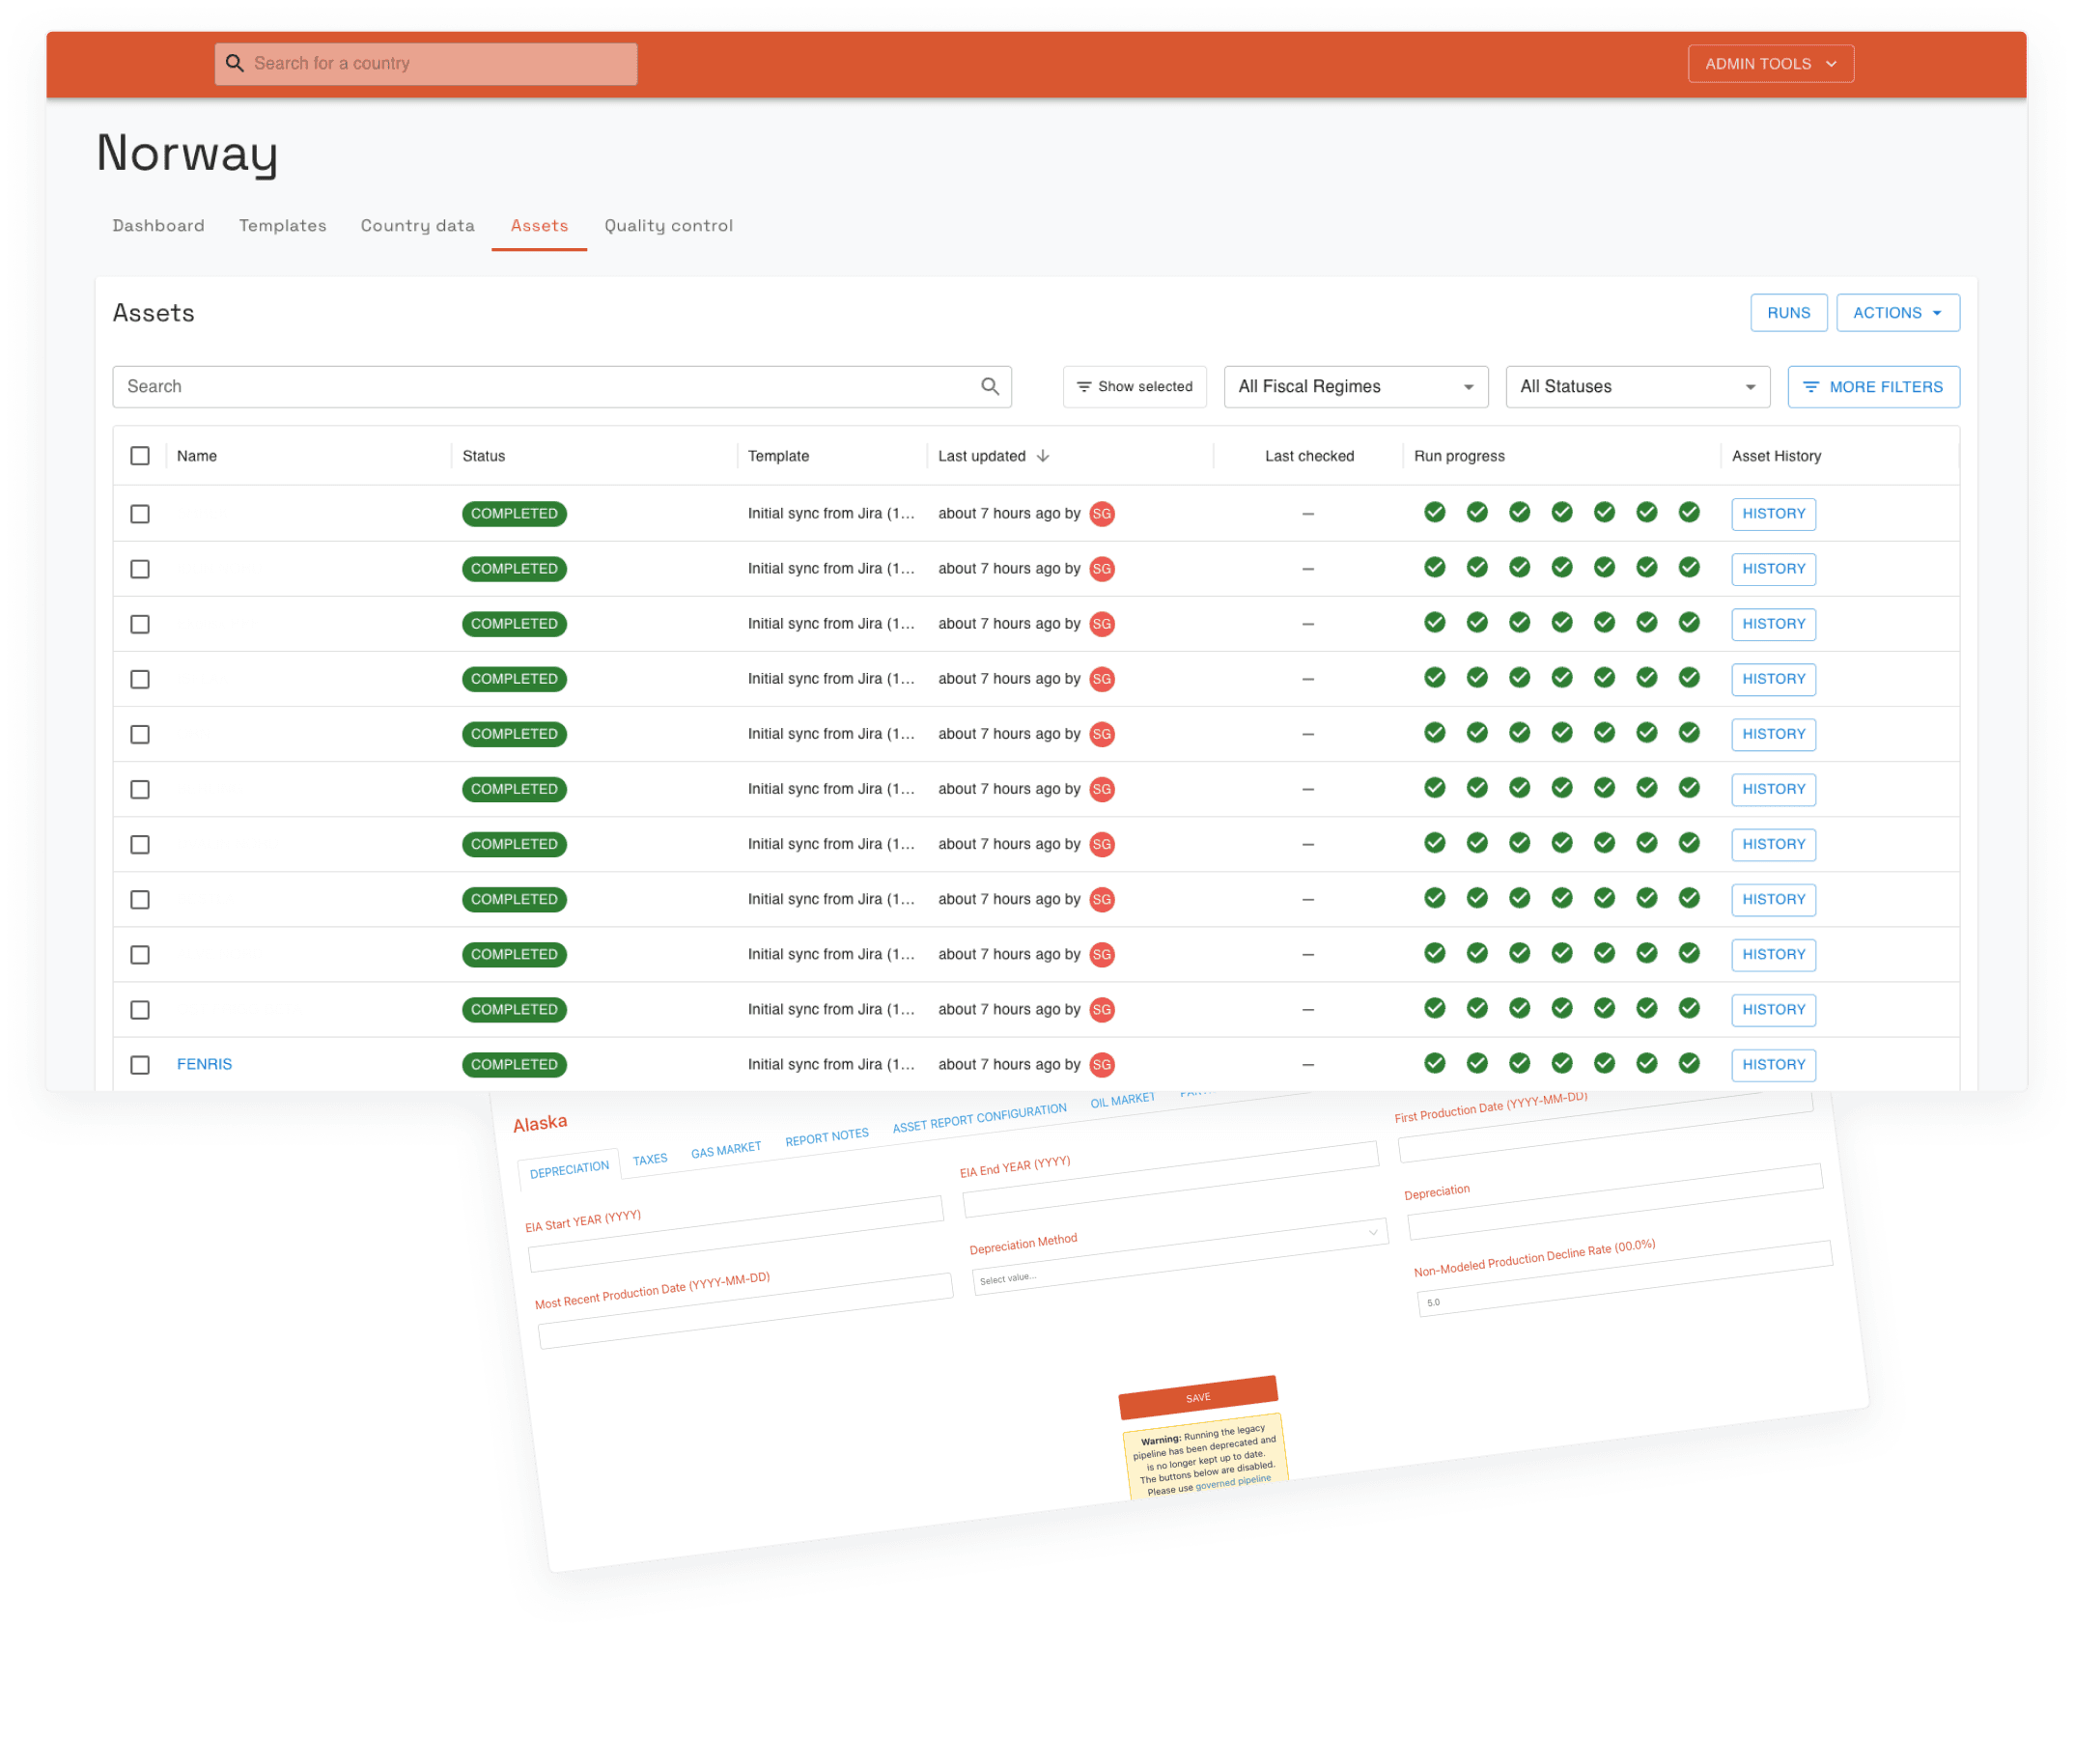
Data pipeline controls were built to manage how raw data is ingested, validated, and transformed before reaching the production environment, ensuring report accuracy at every stage.
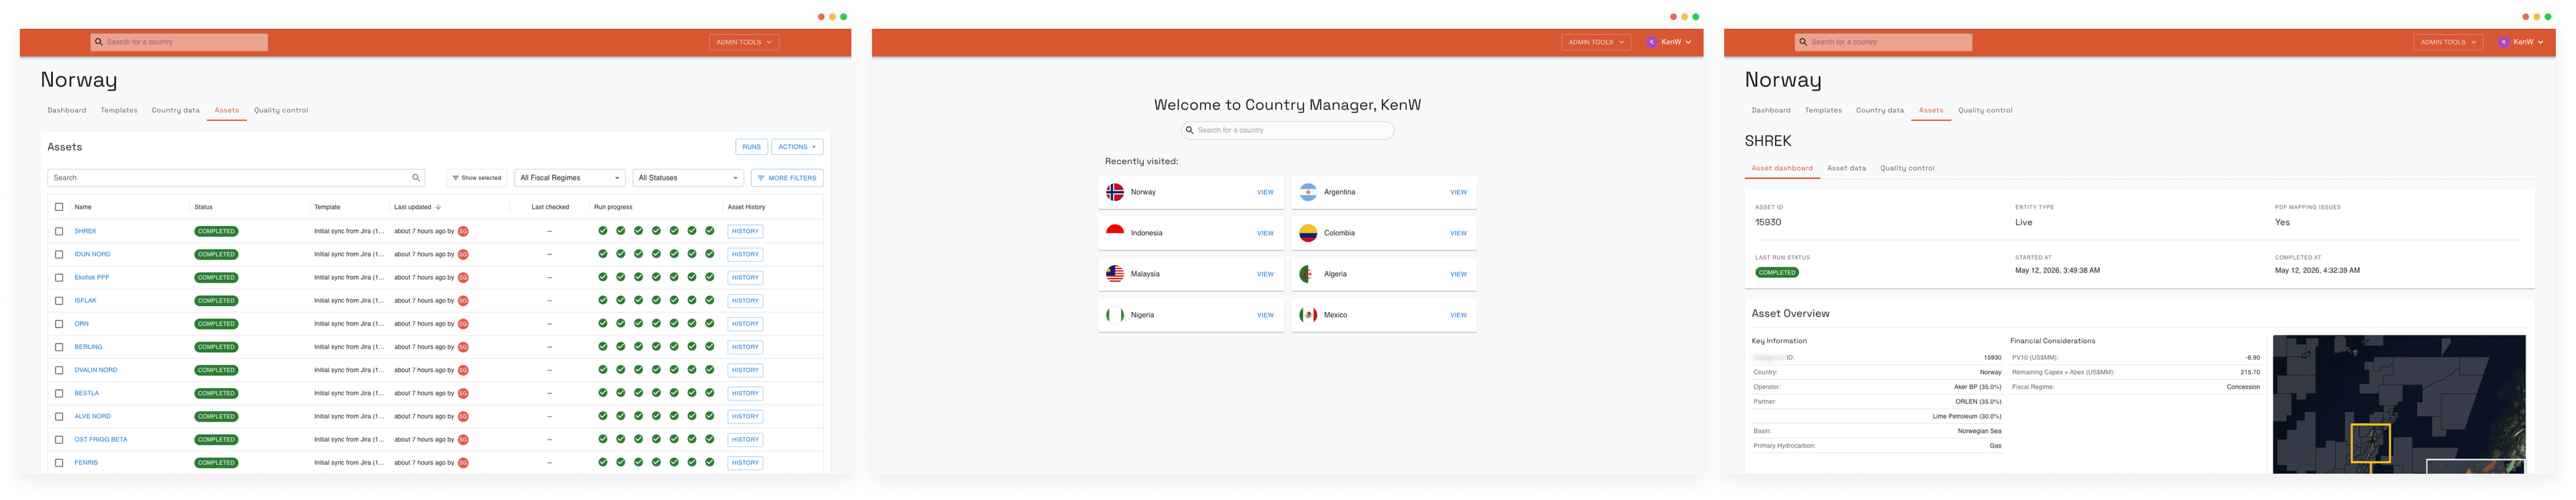
The frontend was built in React.js with TypeScript, chosen for its ability to render complex, data-dense interfaces without sacrificing responsiveness. Energy analysts interact with the platform through interactive charts, filterable data tables, and geospatial map views powered by Google Maps, all of which require the frontend to handle large payloads efficiently on the client side.
The interface was designed around actual analyst workflows: searching by well, filtering by basin or operator, overlaying production data onto geographic views, and generating exportable reports, all within a cohesive experience that models how energy professionals actually work.
The combination of purpose-built architecture and continuous optimization over ten years has delivered measurable results:
Report Generation: Up to 50% Faster. Complex multi-variable analytical reports that previously required extended processing now generate in under 5 seconds, driven by the layered caching strategy and optimized query pipelines.
Average API Response Time: Under 500ms. Through ElastiCache, query tuning, and efficient data modeling, the platform maintains sub-500ms response times across its most data-intensive endpoints, even as dataset volumes have grown year over year.
Infrastructure Storage Costs: ~30% Reduction. The tiered storage strategy, hot data in RDS, warm data in ElastiCache, cold archives in S3, reduced per-country storage costs by approximately 30% compared to a single-database approach.
99.9% Platform Uptime. Across years of continuous operation, the platform has maintained 99.9% availability, a critical requirement for energy professionals who depend on it for daily decision-making.

Up to 50% Faster Report Generation
Average API Response Time < 500ms
~30% Reduction on Infrastructure Storage Costs
99.9% Platform Uptime
This platform was not a project with a finish line. Since 2016, NUS Technology has been the sole engineering team behind the system, from its initial architecture through to ongoing maintenance, optimization, and expansion. The country-based multi-tenant design, the layered caching strategy, the performance-tuned backend: none of these were off-the-shelf choices. They were engineered specifically for the realities of global energy data.
For the client, NUS is the team that built the foundation and continues to run it. As the platform grows into new countries and new analytical capabilities, the same team that designed its architecture is the one scaling it forward.
Get the full story in PDF format, including project details, technical insights, and measurable results you can apply to your own business.


Let’s have a strategic conversation about your goals and how we can achieve results like these for your business.


